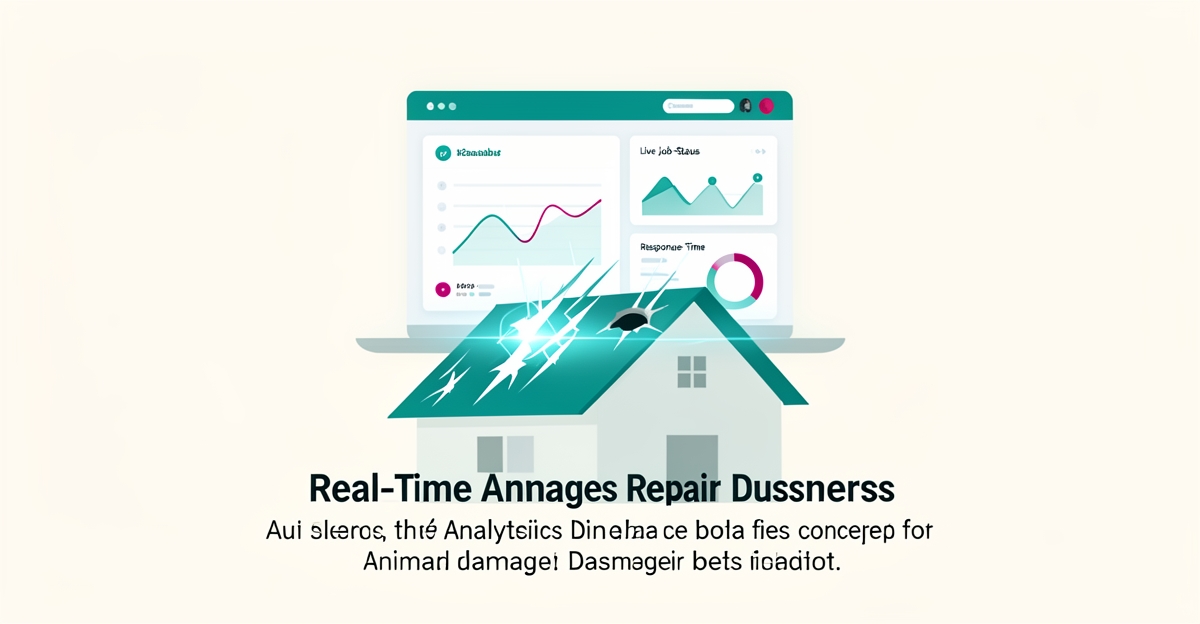
AI-Powered Repair Tracking: How to Build a Real-Time Dashboard for Your Animal Damage Business
Key Facts
- AI-guided preventive maintenance typically reduces unplanned equipment downtime significantly, often by double-digit percentages according to industry reports
- Organizations using AI-supported maintenance programs commonly report meaningful reductions in maintenance costs based on implementation data
- AI customer service agents in well-run deployments typically automate a majority of routine inquiries per Swept AI performance metrics
- Most maintenance software users report improved productivity from better work-order management per eWorkOrders user surveys
- Access control is one of the most common attack surfaces for AI agent deployments, per Microsoft security guidance
- AI adoption across US industries has accelerated sharply since 2023 per ZDNet adoption tracking
Hire a team member that works 24/7 — for less than a part-time wage.
AI receptionists, SDRs, dispatchers and 99+ roles. Trained on your business, fully managed.
Not sure where to start? Ask our AI planner
Why Your Repair Business Is Flying Blind Without Real-Time Data
Animal damage repair runs on urgency. A homeowner with raccoons in the attic or squirrels in the walls doesn't want to wait three days to hear whether a technician is coming. But most repair businesses still track jobs in scattered places: a dispatch whiteboard, a spreadsheet, texts between office staff and crews, and notes buried in a CRM nobody updates.
The cost of that fragmentation is quiet but real. Jobs slip through the cracks. Response times drift longer without anyone noticing. You find out a technician double-booked a route after the customer calls angry. You can't answer the basic question every owner eventually asks: which jobs, which crews, and which service areas actually make money?
A real-time dashboard fixes the visibility problem first. Everything else, AI forecasting, automated customer updates, performance scoring, builds on top of it.
What an AI-Powered Dashboard Actually Does for Repair Tracking
Strip away the jargon and a repair tracking dashboard does four things:
- Live job status. Every job moves through stages, inquiry, inspection, scheduled, in progress, completed, follow-up, and the dashboard shows where every job sits right now, not as of last night's export.
- Response time monitoring. Time from inbound call or form submission to first technician contact, broken out by service area and lead source. This is usually the fastest win, because the data already exists in your phone system and CRM.
- Technician performance views. Jobs completed per day, average time on site, callback rates, and customer satisfaction, side by side, so coaching conversations start with facts instead of impressions.
- AI-assisted summaries and alerts. Instead of staring at charts, you get plain-language briefings: which jobs are at risk of slipping, which crew is overloaded, which service area's response times degraded this week.
The AI layer matters because raw dashboards become wallpaper after a month. What keeps them useful is the system flagging anomalies, unusual callback spikes, a crew falling behind pace, before they become customer complaints.
How to Build Your Dashboard: From Data Cleanup to Live Metrics
Here's the build sequence that works in practice:
- Pick your three metrics. Job completion rate, response time, and technician utilization are a strong starting set. Resist the urge to track twenty things on day one.
- Map where the data lives. Phone logs, scheduling software, invoicing, technician notes. List every source and who owns it.
- Clean the data. Standardize job stage names, deduplicate customer records, and fix inconsistent date formats. This is the least glamorous step and the one that determines whether the dashboard is trustworthy.
- Connect the sources. Most field service tools have APIs or export options. A integration layer pulls them into one place on a schedule, hourly is usually enough for repair tracking.
- Build the views. One screen for the office (today's board, at-risk jobs), one for owners (weekly trends), one for crews (their own queue and schedule).
- Add the AI layer last. Once the data flows reliably, layer on anomaly alerts, natural-language summaries, and forecasting. Building AI on top of messy data just automates confusion.
If the workflow that costs you the most is dispatch and job coordination, a focused rebuild of that single workflow is often the right first move, see how we approach that with AI Workflow Builds. If you want dispatch, customer communication, and reporting connected as one system, an AI Operating System approach handles it in phases you own outright.
Testing, Security, and Avoiding the Failure Modes That Kill AI Projects
Most dashboard projects don't fail on technology. They fail on three predictable problems:
- Dirty inputs. If technicians don't update job status in the field, the dashboard shows fiction. Solve adoption first: make updating easier on mobile than calling the office.
- Access control gaps. Customer addresses, claim details, and payment info flow through these systems. Microsoft's security guidance for AI systems emphasizes that access control is a leading attack surface, lock down who sees what before launch, not after an incident.
- Unverified AI outputs. Any AI-generated summary or customer-facing message needs a review path early on. Test against real historical cases, not demos, and monitor for drift as your business changes.
Build these guardrails in from day one and the system earns the trust it needs to actually get used.
Getting Started: Your First 90 Days With a Live Repair Dashboard
A realistic timeline:
- Days 1–30: Pick your three metrics, map data sources, clean the worst of the data, and stand up a basic live job board.
- Days 31–60: Connect remaining sources, add response-time and technician views, and get crews updating status from their phones.
- Days 61–90: Layer in AI alerts and summaries, tighten access controls, and run your first weekly review off the dashboard instead of gut feel.
By day 90 you should be making at least one operational decision per week from data you couldn't see before.
Still paying for 10+ subscriptions that don’t talk to each other?
We build custom AI systems you own outright. No vendor lock-in. Full control.
Not sure where to start? Ask our AI planner
Frequently Asked Questions
How can an AI-powered dashboard help my animal damage repair business improve response times?
What kind of downtime reduction can I expect from implementing AI-guided preventive maintenance in my repair operations?
Is it difficult to build a real-time dashboard if I don't have coding experience?
Are there security risks with using AI in my business dashboard, especially regarding customer data?
Can AI help automate customer communication in my animal damage repair business?
How do I know if an AI vendor's claims about performance are reliable before investing?
Your Dashboard, Your Advantage: What to Do Next
A real-time repair tracking dashboard turns scattered job data into decisions you can act on today, whether that's spotting which technicians finish jobs fastest, seeing where response times slip, or reallocating crews before backlogs pile up. Industry reports consistently show that AI-supported maintenance and work-order management improve productivity and cut unplanned downtime, and for an animal damage business those gains translate directly into faster claim turnarounds, better technician utilization, and customers who can actually see the status of their repair. The next step is simple: identify the three metrics that matter most to your operation, job completion rate, response time, and technician performance are a strong starting set, and map where that data currently lives. If pulling it together feels like more than a weekend project, AIQ Labs builds custom analytics systems that consolidate your tools into a single live dashboard you own outright. Start with the two-minute Fit Check at aiqlabs.ai/apply, then book a free 30-minute strategy call at aiqlabs.ai/book, a real working session to map your biggest bottleneck and whether a dashboard is the right first win. If it isn't, we'll tell you that too.
Make AI your competitive advantage — not just another tool.
Strategy, implementation and ongoing optimization. One partner, end to end.
Not sure where to start? Ask our AI planner